Reproduce performance issues in network server applications
Introduction
A network server application runs 24/7, mostly unattendedly. When an error happens, the log file is the first tool to figure out the issue. When log file is not enough to understand the issue, we are facing a difficult problem before fixing the bug: reproducing the bug reasonably fast. For a network server application, it means to find a small enough set of packets that drives the application to display the bug quickly.
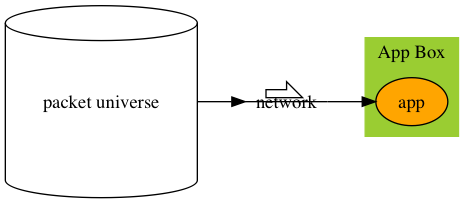
Operations’ view
A whole packet universe, and a long period of days even weeks, to drive the app to show the bug.
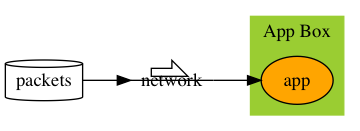
Developer’s view
A small subset of packets, and minutes, to drive the app to show the bug. The rest of the packet universe are noises.
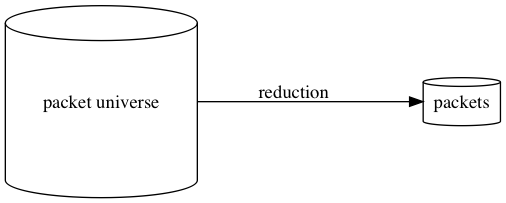
The problem
Reduce the packet universe, and make app to reproduce the expected bug faster.
The solution
The machine way
Split the packet universe in half, drop the half that doesn’t reproduce the bug. Until the subset is reasonably small. It’s a binary search.
The human way
Observe and speculate, pick a subset, feed it to the app. Hit the jackpot if the app errs.
The defects of the solution
The logical bugs can be reproduced the machine way, the human way or the combination of both. But performance issues, memory usage steady growth, or CPU peaking periodically are different. The subset may never reproduce the same bug. What are we missing?
We need some intensity.
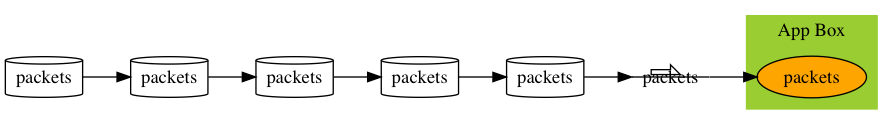
The fix
Repeat packets serially
We clone a set of packets and repeat that again and agin over the network.
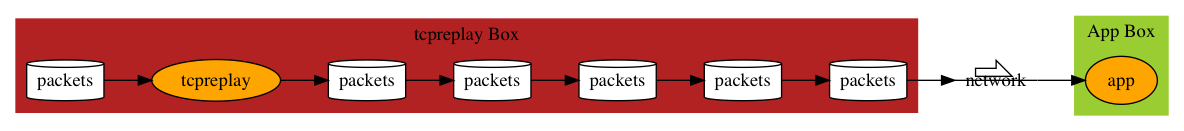
tcpreplay
tcpreplay reads packets capture and plays them back over the network. When the packet capture is done, it starts from begin again.
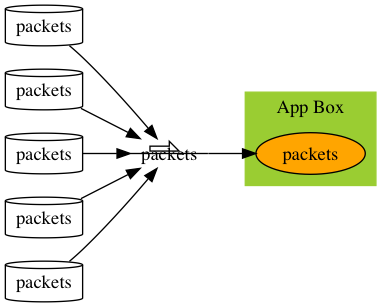
Repeat packets in parallel
The intensity is not enough to reproduce the performance issue quickly? Increase the intensity by play the clone of packets in parallel. By parallel, the packets are cloned and mixed, not one set after the other.
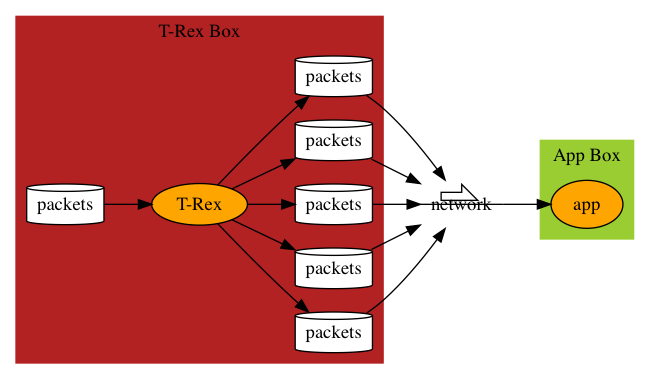
T-Rex
Cisco t-rex is the tool to achieve this. It can also reduce inter-packet gaps, give it valid and different IP/ports to make it more real.
T-Rex can be set up in physical box, or VirtualBox VM: https://trex-tgn.cisco.com/trex/doc/trex_vm_manual.html. Below is its VM configuration.
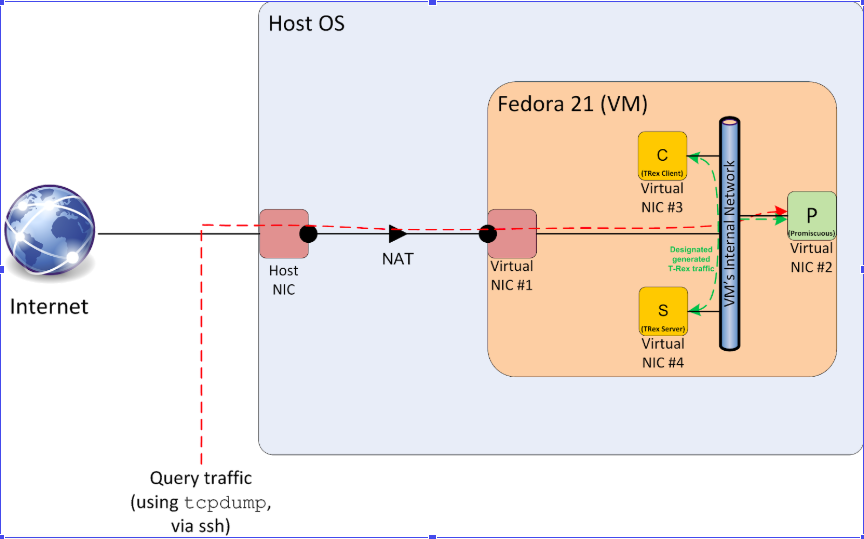
The VM is configured 4 NICs.
| NIC | Function |
|---|---|
| #1 | NAT NIC for ssh |
| #2 | The port to be used to capture network traffic |
| #3 | Client port, t-rex sends requests from this NIC |
| #4 | Server Port, t-rex receives requests and sends responses on this NIC |
Break the Limit of T-Rex
T-Rex Box Diagram above is actually not accurate. T-Rex doesn’t accept any packets. It only accepts packets in the same session. That is, packets between same IP/Port pairs. So we need a tool to break packets into sessions.
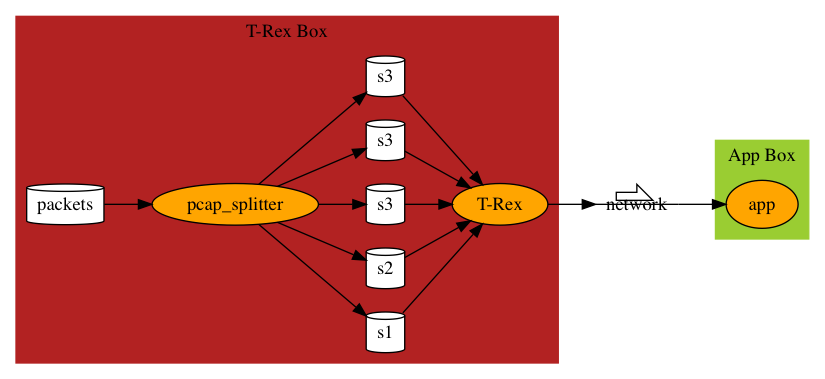
pcap splitter
yaml-gen.sh packets.pcap
yaml-gen.sh takes in one pcap file and splits it into multiple pcap files, one for each session. It also generates packets.yaml for t-rex to run with.
yaml-gen.sh calls pcap to do actual splitting. pcap is a go program. You can find its source here
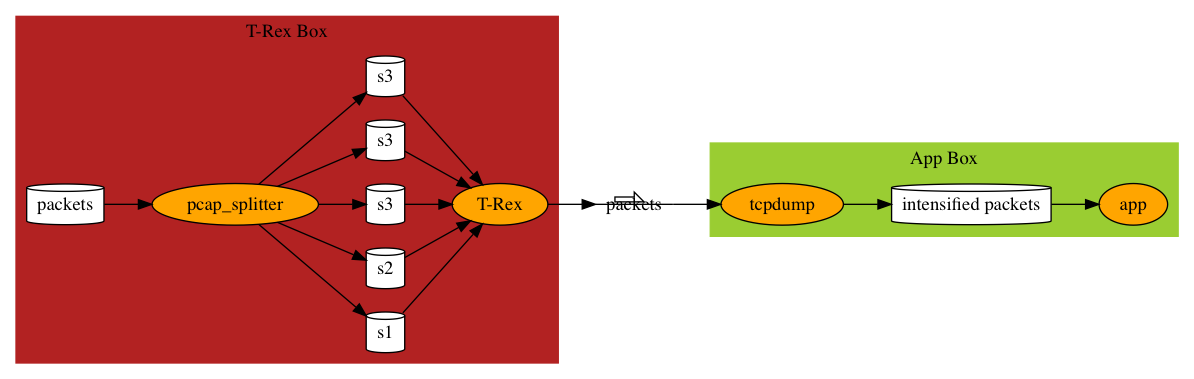
Remove asynchronicity
When you have a set of packets flow from the network that reproduces the expected behavior, you are almost ready to debug the application. However, there’s still one thing annoying. When you pause the program to check for things, the packet still comes in asyncrhonously. The application receives different packet pattern in debug mode than in releases full-speed mode. When you restart the program, the application receives a random, different set of packets. It’s hard when you are on something and pause and check, every time it has different context as the next packet coming in is different. Asynchronicity of the incoming packets creates non-deterministic environment for the application.
Imagine that your application doesn’t miss one packet, and it always starts from the same packet. Everything is cause and effect. It greatly helps you to debug the applicationn.
How can we achieve this?
This is actually pretty simple to achieve.
We use tcpdump to record the intensified packet flow and let the application read the captured packets directly. Most of the time, this way can still reproduce the bug driven by network packets. We can record different number of packets to test the application.
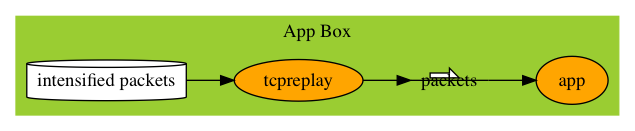
Add back asynchronicity
If some issues have to do with asynchronicity and you want to add asynchronicity back, you sure can start the T-Rex Box and run T-Rex there to generate the intensified packets. But you don’t have to. Now that you have intensified packets generated by T-Rex, you can run it with tcpreplay on the same machine.
Regression
Suppose with intensified pcap files we found the issue and fixed it, how do we verirfy it step by step?
- Verify it with small set of intensified packets.
- Verfy it with larget set of intensified packets.
- Verify it with local network packets by replaying intensified packets through tcpreplay.
- Verify it with local T-Rex VM with generated yaml configurations.
- Verify it with physical T-Rex box in a setup regression test environment constantly.
- Put it to test in production.